
Figure 6. The effect of scyllatoxin on SK3 current and the AHP.
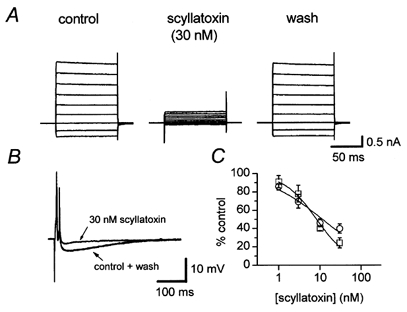
A, SK3 current recorded from a transfected CHO cell immediately before (control) and after 3 min exposure to 30 nm scyllatoxin. Recovery was complete 2 min after washout. B, 30 nm scyllatoxin caused a similar degree of inhibition of the AHP recorded from a rat SCG neurone. Each trace is the mean of 3 successive action potentials and AHPs recorded before (control), after 3 min exposure to scyllatoxin and 7 min after washout. The traces before and after application of scyllatoxin are almost identical. The membrane potential of this cell was -57 mV. C, concentration-inhibition curves for block of SK3 current (□) and the AHP (○) by scyllatoxin. The fitted lines were drawn using the Hill equation and the estimates of IC50 are given in Table 1. Each point is the mean of 3-4 observations and the vertical bars indicate the s.e.m.