
Figure 4. Increased number of mIPSC bursts in GVG-treated cells.
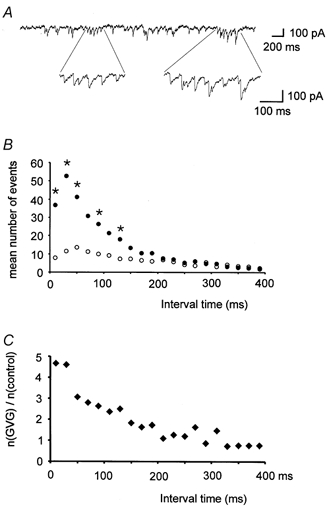
A, sample trace from a GVG-treated cell showing the occurrence of bursts of mIPSCs. B, mean number of events within 20 ms classes of interevent intervals (11 cells each for control (○) and GVG-treated cells (•)). Note the large increase in short interevent intervals in the presence of GVG. Significant differences between GVG-treated and control cells (P < 0.05, Mann-Whitney U test) are marked by asterisks. C, relative frequency of events in 20 ms classes of interevent intervals (mean number of events (n) in GVG-treated cells divided by mean number in control cells). GVG-treated cells show a 4- to 5-fold increase in the number of mIPSCs within 40 ms after the preceding mIPSC. At intervals beyond 150 ms there is virtually no difference in the number of detected events.