
Figure 2. Time course of pH and metabolite concentrations during ischaemic exercise.
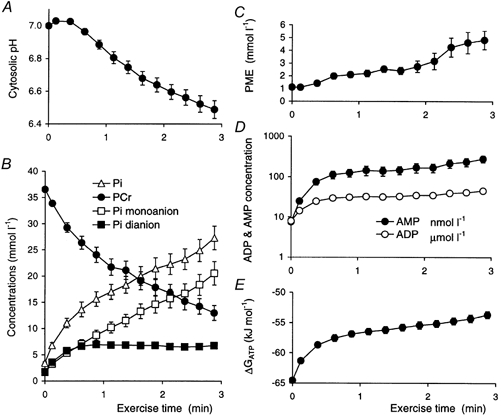
A, cytosolic pH. B, the concentrations of phosphocreatine, and of inorganic phosphate and its two ionic components. C, phosphomonoester concentration. D, the concentrations of free ADP and free AMP (note logarithmic scale). E, the free energy of ATP hydrolysis. Error bars show s.e.m.