
Figure 4. Proton handling during ischaemic exercise.
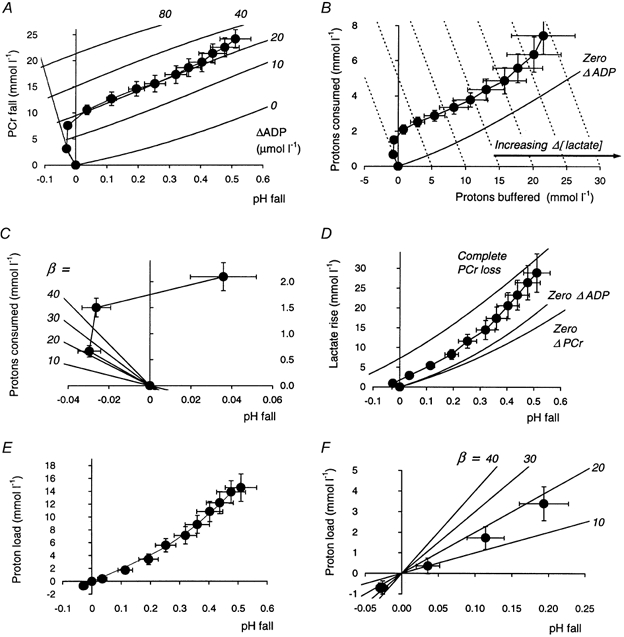
The figure shows several quantities plotted in a time-independent, cumulative manner during exercise. A, the fall in PCr as a function of that in pH; the lines in the background represent lines of constant suprabasal ADP concentration, varying from no increase in ADP to ‘infinite’ ADP, i.e. complete PCr depletion (calculated from eqn (37)). B, the cumulative amount of protons that this process ‘consumes’ (∫γd[PCr]), plotted as a function of the cumulative amount of protons ‘buffered’ (-∫βdpH); the continuous line represents no increase in ADP (calculated from eqn (37)); lines of constant non-zero increase in ADP could be plotted above this, as in Kemp (1997), but are omitted here for clarity. The dashed lines show constant lactate change (eqn (36)); for each, Δ[lactate] is simply equal to the x-co-ordinate. C, an expansion of the initial region of a plot of protons ‘consumed’ (∫γd[PCr]) as a function of pH fall: the lines radiating from the origin represent nominal values of buffer capacity as indicated (calculated from eqn (13)); the initial (alkaline) point corresponds to a buffer capacity of 20 mmol l−1 (pH unit)−1 (see Results), before lactate production moves the data points in the direction of acidification despite progressive proton consumption by continuing PCr hydrolysis. D, the amount of lactate accumulated as a function of pH fall; the slope of this line is the apparent buffer capacity -d[lactate]/dpH. E, the net proton load to the cytosolic buffers (i.e. the difference between lactate production and proton consumption by PCr splitting (eqns (10) and (12)) as a function of pH fall: the slope of this line (-d[H+load]/dpH) is an estimate of true buffer capacity. F, an expanded view of the near-rest region in E, with lines of constant buffer capacity (from eqn (13)). Error bars show s.e.m.