
Figure 8. Metabolic fluxes and some metabolite concentrations during ischaemic exercise.
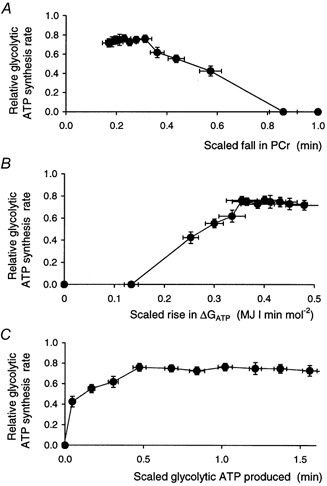
The figure shows the glycolytic ATP synthesis rate plotted as a function of several quantities: the change in PCr concentration (A), the change in free energy of ATP hydrolysis (B), and the cumulative amount of glycolytic ATP synthesis (C). In each case both the glycolytic ATP synthesis rate and the quantities on the x-axis have, to minimise intersubject variability, been divided by the initial ATP turnover rate. Data are means ±s.e.m.