
Figure 10. Some absolute constraints on pH and metabolite changes during ischaemic exercise.
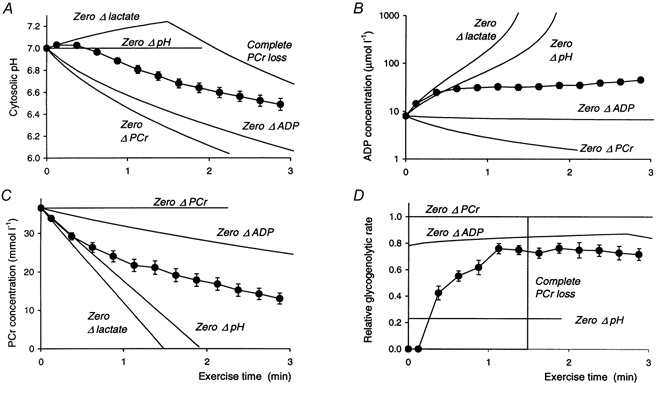
The figure shows some absolute constraints on pH and metabolite changes (A-C) by considering some extreme situations: no lactate production (eqn (32)) until all PCr is exhausted (eqn (34) with maximal [Pi]); lactate production in the absence of PCr depletion (eqn (34) with resting [Pi]); coordinated control of lactate production in relation to PCr depletion such that pH does not change (eqn (33)); and coordinated control of lactate production and PCr depletion such that ADP does not change (eqn (37)). D, the corresponding rates of glycolysis. All constraints are expressed in the time domain using eqn (35). These theoretical lines are as labelled. The observed data are shown as filled circles (means ±s.e.m.).