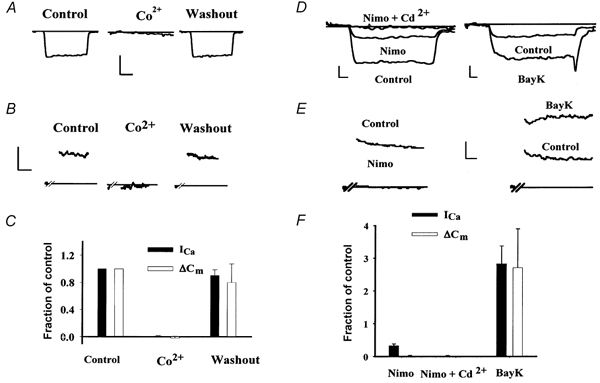
Figure 3. Pharmacology of calcium influx and exocytosis.

A and B, calcium currents (ICa; A) and capacitance changes (ΔCm; B) evoked by depolarizations to -21 mV are shown for two different cells before, during, and after substitution of 5 mm Co2+ for Ca2+ in the external medium. C, summary data for cells reversibly exposed to 5 mm Co2+. D and E, calcium currents (ICa; D) and capacitance changes (ΔCm; E) evoked by depolarizations to -21 mV are shown for another two cells before and after exchanging the bath solution for one containing either nimodipine (Nimo) or Bay K 8644. (Note as in B the capacitance trace in E has been abridged during the 1 s control and 3 s test depolarizing pulses when measurements are not interpretable.) ICa was elicited with 15 ms depolarizations to -21 mV. Residual ICa following nimodipine exposure was blocked by the addition of 200 μm Cd2+. F, summary data for cells exposed to either nimodipine, nimodipine + Cd2+ or Bay K 8644. In both C and F, the magnitude of ΔCm (□) and ICa (▪) is expressed as a fraction of the control value ±s.e.m. Calibration bars: A: 40 pA, 5 ms; B: 40 fF, 500 ms; D: left trace 20 pA, right trace 50 pA, 2 ms; E: 40 fF, 300 ms.
