
Figure 9. CVs and activity-dependent slowing in cold and other type 2 units.
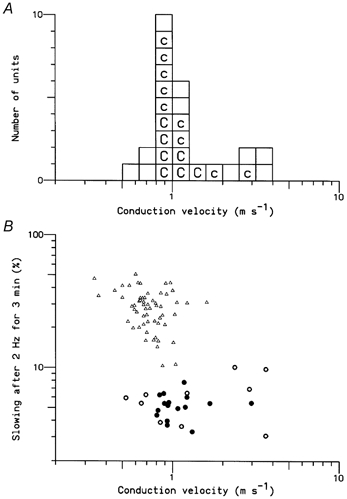
A, Distribution of CVs (logarithmic scale). Each box represents a single type 2 unit: ‘c’ denotes units identified as cold-specific receptors, ‘C’ indicates units that were fully characterised. B, relationship between CV and the degree of slowing after stimulation at 2 Hz for 3 min. The triangles represent the 80 type 1 units. The thick and filled circles represent the 26 type 2 units. The filled circles indicate cold-specific receptors.