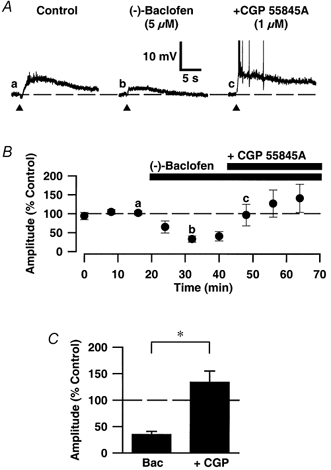
Figure 2. The (-)-baclofen-induced depression is reversed by CGP 55845A.

A, synaptic traces of EPSPMs recorded: a, in the presence of AMPA, NMDA and GABAA receptor antagonists (Control); b, in the additional presence of 5 μm (-)-baclofen; and c, subsequent co-application of 1 μm CGP 55845A. The membrane potential of the cell was -64 mV. The graph (B) shows a plot of the mean peak amplitudes of successive EPSPMs, for pooled data, to illustrate the temporal profile of the depressant effect of (-)-baclofen on the EPSPM and its reversal by CGP 55845A. Amplitudes are expressed as a percentage of the mean amplitudes of the three EPSPMs prior to application of (-)-baclofen. C, bar graph illustrating pooled data for the effects of 5-10 μm (-)-baclofen (Bac; n = 7) and 5-10 μm (-)-baclofen + 1 μm CGP 55845A (+ CGP; n = 7) on the EPSPM. The amplitudes of EPSPMs are expressed as a percentage of the mean value of the control EPSPMs. Note that (-)-baclofen significantly depressed the EPSPM whilst responses following co-application of (-)-baclofen + CGP 55845A were not significantly different from control responses. Data are means ±s.e.m.; * statistically significant compared with (-)-baclofen group (P < 0.05). In this and subsequent figures, the bars above the graph (B) indicate the duration for which the drug was applied.
