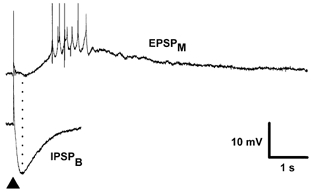
Figure 6. Kinetic comparison of the IPSPB with the EPSPM.

Traces are an EPSPM (top) recorded in the presence of GABA and glutamate receptor antagonists NBQX, CGP 40116, picrotoxin and CGP 55845A and an IPSPB (bottom) in the presence of NBQX, CGP 40116, picrotoxin and the GABA uptake inhibitor NNC 05-711. The membrane potentials of the neurones are -64 mV and -62 mV, respectively. Note that even in the presence of an inhibitor of GABA uptake, the isolated IPSPB peaks prior to the start of the depolarizing EPSPM and that the hyperpolarizing response is all but complete by the peak of the EPSPM. The dotted line indicates the time of the peak of the isolated IPSPB, which was evoked in the presence of the GABA uptake inhibitor.
