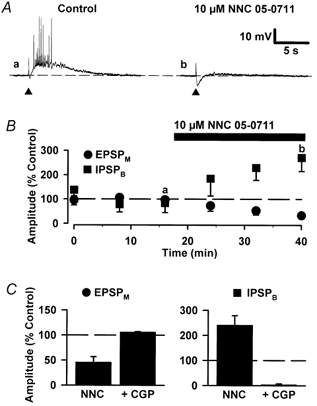
Figure 7. The effects of an inhibitor of GABA uptake on EPSPMs and IPSPBs.

A, synaptic traces of representative IPSPB/EPSPMs recorded in control (a) and in the presence of NNC 05-0711 (10 μm) (b). The membrane potential of this neurone was -64 mV. B, mean peak amplitude of successive EPSPMs and IPSPBs, for pooled data (n = 4), versus time illustrating the depression of the EPSPM and the enhancement of the IPSPB by NNC 05-0711. The bar above the graph indicates the duration for which NNC 05-0711 was applied. C, bar graphs illustrating pooled data for the effects of 10 μm NNC 05-0711 (NNC; n = 4) and 10 μm NNC 05-0711 + 1 μm CGP 55845A (+CGP; n = 3) on the EPSPM and IPSPB. Note that NNC 05-0711 depressed the EPSPM and that CGP 5845A reversed this effect.
