
Figure 1. Force and surface EMG during a representative experiment.
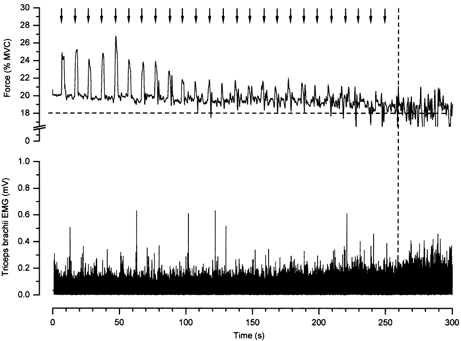
The elbow extension force (top) and the surface EMG from triceps brachii muscle (bottom) for an entire contraction in one subject are displayed. Arrows indicate the onset of the vibration (2 s in duration) and the initial augmentation of force associated with the vibration. The criteria for determining endurance time are displayed with dashed lines. At the endurance limit, the force in the holding phase dropped below 18 % MVC. Note the increase in surface EMG near the endurance limit.