
Figure 3. Modulation of motor unit discharge rate during the main experiment.
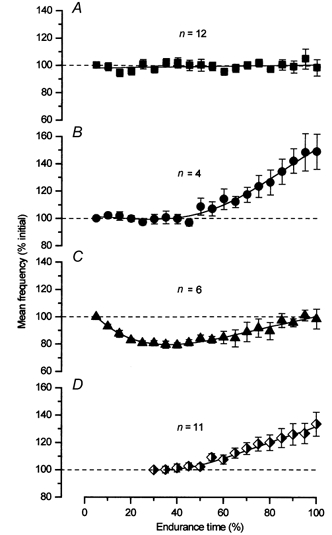
The mean ±s.e.m. firing frequencies of all motor units throughout the task are grouped according to the type of modulation in discharge rate during fatigue. The data for each motor unit are normalized to its initial firing frequency. Panels A, B and C represent motor units that were active from the beginning of the contraction; panel D represents the units that were recruited during the fatigue task. The majority of the units that were active from the beginning (12/22) did not demonstrate a change in discharge rate with fatigue (A). Four motor units demonstrated an increase in discharge rate (B), while six were found to decrease and then return to baseline (C). The newly recruited units (D) showed an increase in discharge rate (9/11).