
Figure 4. Discharge rate of two motor units during the vibration and holding phases.
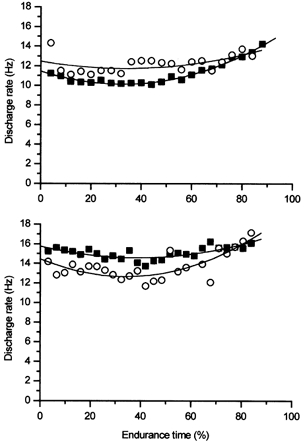
Discharge rates of single motor units in two different experiments during the 2 s vibration (○) and 8 s holding phase (▪) are presented. The motor unit displayed in the top panel had a higher discharge rate during vibration than the holding phase. Another subject exhibited a lower motor unit discharge rate during the vibration than the holding phase (bottom panel).