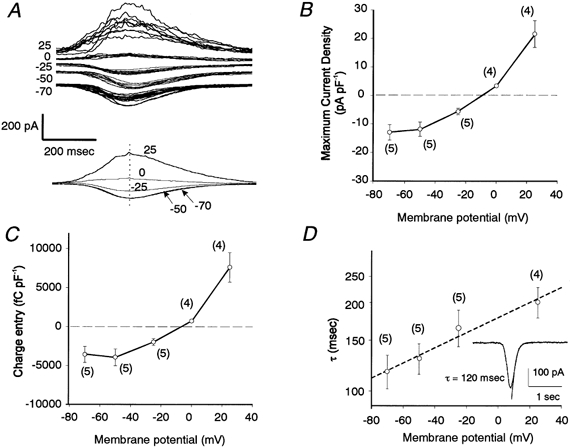
Figure 2. I–V relationship and time constant of decay (τ) for the oscillatory currents evoked by ET-1 (50 nm).

A, superimposed current traces (n = 5–12, upper traces) and averaged traces (lower traces) at the indicated membrane potentials (mV). Time to peak is matched for each trace. B and C, peak current density and charge entry during a single deflection, respectively. D, relationship between values of τ and membrane potential shown on a semi-logarithmic scale. Values on y-axis are shown as a linear sequence to facilitate understanding. The dashed line was drawn using least-squares linear regression analysis (slope = 0.0059, y intercept = 5.18, r = 0.38). Inset, a typical current trace obtained at a holding potential of −70 mV, together with the curve drawn by exponential fitting. α-GA (25 μm) was present throughout.
