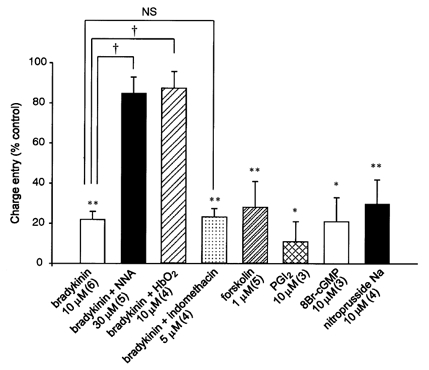
Figure 6. Summary bar graph showing blockade of the ET-1-induced response by bradykinin and activators of various second messenger pathways.

Summated charge entry (over 100 s) is normalized with respect to the value obtained before a given intervention. α-GA (25 μm) was present throughout. *P < 0.05, **P < 0.01versus control value (100 %). †P < 0.001versus bradykinin-treated group. NS, not significant.
