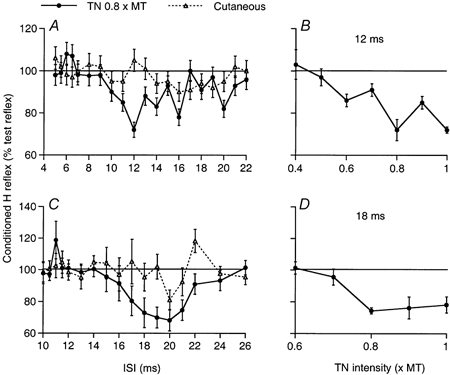
Figure 7. Modulation of the soleus and quadriceps H reflexes by a conditioning stimulation to the tibial nerve.

A and C, time courses of the variations in the Sol (A) and Q (C) H reflexes when preceded by a conditioning stimulation to the TN (0.8 × MT; •) or a cutaneous stimulation to the skin of the heel (▵; allowance being made for the extra peripheral conduction time); changes in the conditioned H reflex (expressed as a percentage of the unconditioned reflex) are plotted against the interstimulus interval (ISI). B and D, effects of varying the TN stimulus intensity on the Sol (B, 12 ms ISI) and the Q (D, 18 ms ISI) H reflexes. Each symbol represents the mean of 20 measurements. Vertical bars = 1 s.e.m. Same subject as in Figs 2 and 3.
