
Figure 3. Threshold input to proximal apical branches triggers initiation in the axon, even if the Na+ conductance density in the axon and soma are equal.
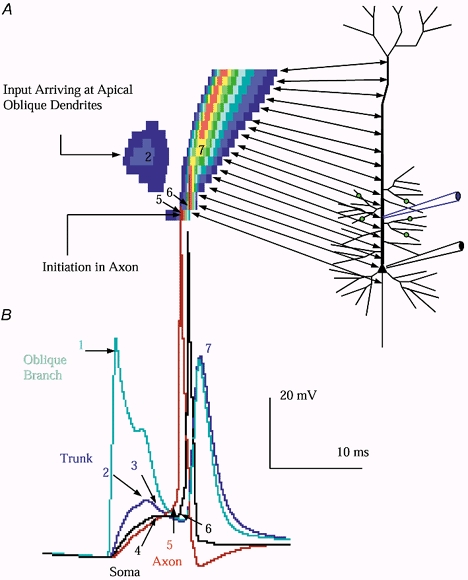
A, spatiotemporal plot of the threshold sequence of events. The two-headed arrows indicate the correspondence between the ordinate of the spatiotemporal plot and location along the axo-somato-dendritic axis. The numbers correspond to the spatiotemporal location of some of the numbered points on the traces. The spatiotemporal location of initiation is indicated. B, in the absence of background, when input reached 13 nS per branch, 65 nS total, the second barrage triggered initiation in the axon with subsequent somatic firing and backpropagation. The following sequence of events was observed (numerals refer to arrow numbers in the figure): (1) The synaptic input triggered firing in the branches receiving input. (2) Voltage in the adjacent apical trunk rose to a peak of 12 mV, before (3) beginning to repolarize. After a several millisecond delay, (4) voltage at the soma and proximal axon approached threshold, about −55 mV. (5) Axonal voltage accelerated ahead of the soma, with firing initiating in the proximal axonal segment, followed by the soma. Note the sharp 90 deg inflection in the somatic trace (6) indicating the impact of the axon firing accelerating the rise of somatic voltage. Following somatic firing, an Na+ channel-dependent voltage wave propagated outward through the apical dendrite (Rhodes & Gray 1993; Stuart & Sakmann 1994), (7) arriving in the apical trunk during the downslope of the EPSP as observed in vitro. The red trace is the proximal axon, the blue trace is the trunk, the teal trace is an oblique branch receiving input, and the black trace is the soma.