
Figure 4. Concentration dependence of potentiation and inhibition of ICRAC by 2-APB.
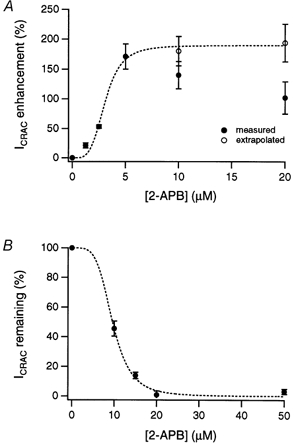
A, extent of ICRAC potentiation as a function of 2-APB concentration. Filled circles show peak currents measured from experiments similar to those in Fig. 3. To correct for the overlap of potentiation and inhibition at 2-APB concentrations ≥ 10 μm, peak currents were also estimated by back-extrapolation (open circles; see text). The dashed line indicates a fit to the Hill equation Y =Ymax/(1 + ([2-APB]/K1/2)nH), where Ymax is the maximal potentiation, K1/2 is the concentration that yields half-maximal potentiation, and nH is the apparent cooperativity of the process. The best fit was obtained with K1/2= 3.1 μm and nH= 4.1. B, degree of ICRAC inhibition as a function of 2-APB concentration. Inhibition was calculated from the steady-state current level relative to the peak current after addition of 2-APB. The dashed line is a fit of the Hill equation, with K1/2= 9.6 μm and nH= 4.2. Experimental conditions were as described for Fig. 3; holding potential =+30 mV. In A and B, each point represents the mean ±s.e.m. of three to five cells.