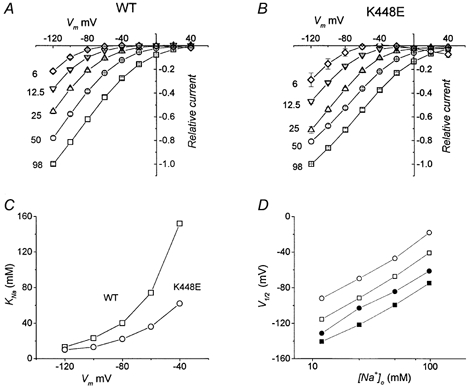
Figure 5. Transport-associated current as a function of Na+ concentration.

A and B represent the average I–V relationships for the transport-associated current from wild-type and mutated transporters, respectively. Before averaging, data were normalized to the current at −120 mV and 98 mm Na+ for each oocyte. Data are means ±s.e.m., n = 4 for both panels. Fitting a Hill equation (nh = 1.3) to the current [Na+]o gives the values of KNa plotted in C for WT (□) and K448E (○). D, the filled symbols represent the sodium dependence of the transport-associated current (data taken at the 0.5 level of the current in A and B for wild-type (□) and mutated (○) forms. For comparison, the values of V11/2sol;2 from the Q–V curves in Fig. 4 have been plotted as a function of [Na+]o for wild-type (□) and mutated (○) transporters.
