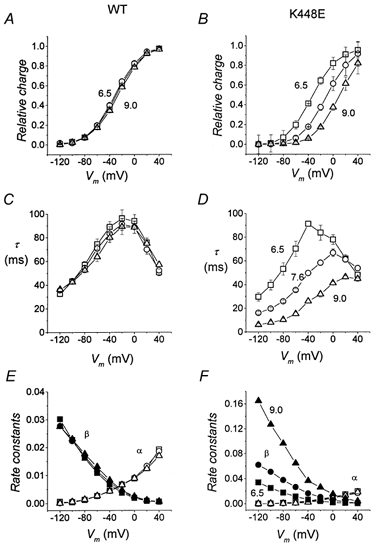
Figure 8. Effect of pH on the charge-voltage characteristics.

The position of the Q–V curves is not affected by pH in wild-type (A), while a progressive shift towards more negative values can be observed in the K448E mutated isoform (B). Symbols are as follow: pH 6.5, □; pH 7.6, ○; pH 9, ▵. Means ±s.e.m. from 33 oocytes (4 batches); each oocyte was tested at pH 7.6 and at least one other pH value; each Q–V curve was fitted with a Boltzmann function and normalization was performed using Qmax at pH 7.6 for each oocyte. C and D, relaxation time constants for wild-type and mutated form, respectively, obtained by fitting a single exponential to the transients as in Fig. 3; the rate constant for V = −40 mV was obtained from the ‘off’ transients. E and F, unidirectional rate constants for charge movement, calculated from Q–V and τ-V curves for wild-type (E) and K448E (F). In both panels open symbols represent the rate constant for outward charge movement (α) and filled symbols represent the rate constant for inward charge movement (β): pH 6.5, squares; pH 7.6, circles; pH 9.0, triangles.
