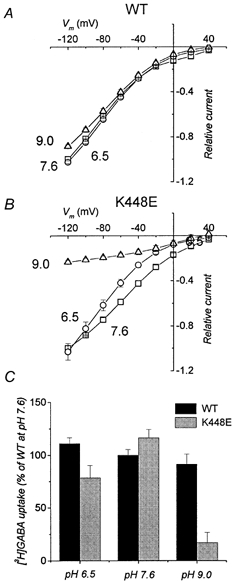
Figure 9. pH effect on I–V relationship for transport-associated current.

Average values are shown for wild-type (A) and mutated (B) transporter. Data were normalized to the value at −120 mV and pH 7.6 for each oocyte before averaging (mean values ±s.e.m., n = 8 for wild-type; n = 10 for K448E). C, uptake of [3H]GABA in oocytes expressing wild-type or K448E mutated form of rGAT1 at different pH values. While in wild-type no significant difference can be seen at the various pH values, in the K448E form transport is partially reduced at pH 6.5 (P < 0.01) and strongly inhibited at pH 9.0 (P < 0.001). Oocytes from the same batch; bars represent s.e.m.(n = 6).
