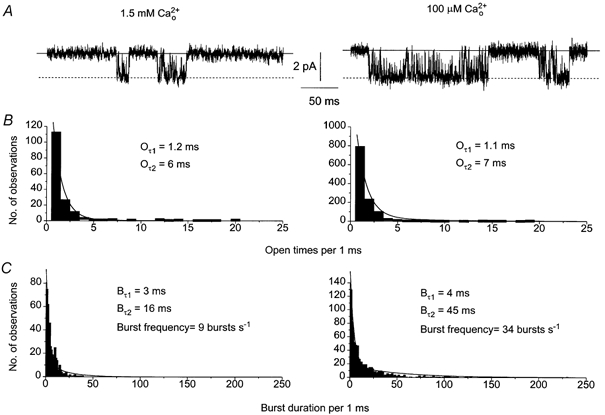
Figure 4. Single cation channel activity in 100 μm .

A, effect of reducing from 1.5 mm to 100 μm on channel currents recorded from the same patch. In 100 μm the channel currents showed significantly longer bursts of channel activity. B, effect of reducing from 1.5 mm to 100 μm on the open time distributions of the single channel currents shown in Fig. 4A. Changing from 1.5 mm to 100 μm did not alter Oτ1 or Oτ2. C, burst duration distributions of the single channel currents shown in Fig. 4A. Reducing from 1.5 mm to 100 μm did not change Bτ1 but increased the Bτ2 from 16 ms to 52 ms.
