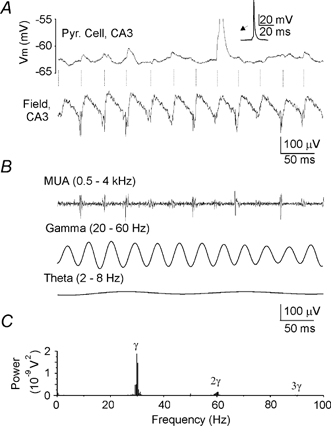
Figure 2. Anoxia-induced network oscillations (ANOs).

A, current-clamp recordings from a putative CA3 pyramidal cell (upper trace) and the extracellular field potential (lower trace) during ANOs. Note that oscillations of the membrane potential that occasionally trigger action potentials are locked to the negative phase of ANOs. The separation distance between the pyramidal cell and field recording site is < 100 μm. B, extracellular field record from above (A) filtered for action currents, gamma and theta activity. Note that multiple units activity (MUA) is phase locked to the negative phase of gamma cycles during ANOs. C, power spectrum of ANOs determined by fast Fourier transform analysis reveals a peak of oscillations at 30 Hz (γ) and its harmonics (2γ, 3γ).
