
Figure 1. Determination of the microdialysis probe recovery for adenosine and the adenine nucleotides.
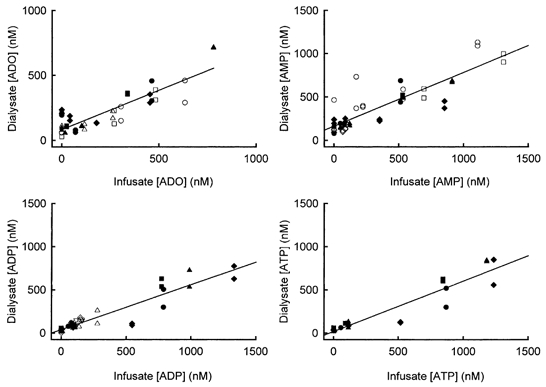
Each point represents one sample at one perfusate concentration: the filled symbols are the experiments (n = 4) in which a mixture of adenosine and adenine nucleotides was infused, and the open symbols are the experiments (n = 5) in which the compounds were infused separately. Recovery was equal to the slope of the line.