
Figure 4. Interstitial adenosine and adenine nucleotides concentrations in normoxia or systemic hypoxia.
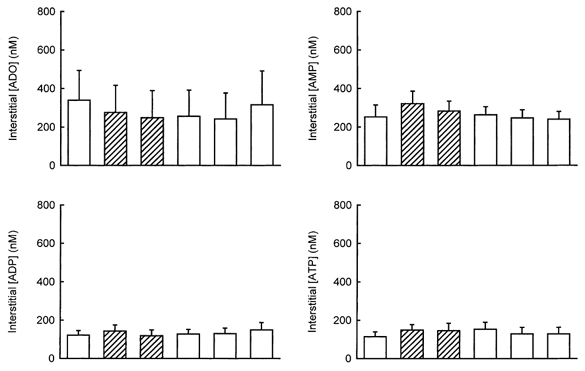
Samples were collected for 10 min each during normoxia and for 7 min each during hypoxia. Hypoxic sample collection was started after the fifth minute of hypoxia. The values are the means ±s.e.m.. of 10–11 tests in 11 dogs. □, normoxia;  , hypoxia. There were no significant differences between any of the hypoxic samples and their pre-controls in a paired t test.