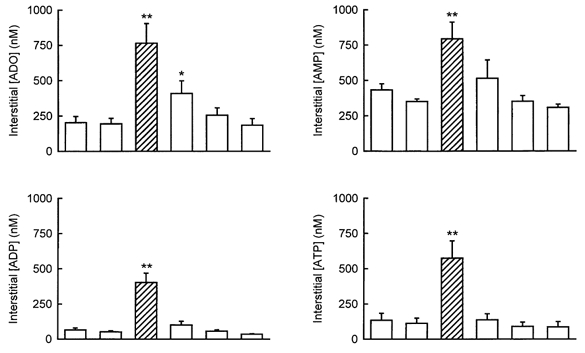
Figure 6. Interstitial adenosine and adenine nucleotides concentrations at rest or during muscle contractions.

Samples were collected for 10 min each. Values are the means ±s.e.m.. of eight tests in six dogs. □, rest;  , contractions. Asterisks indicate values that were significantly different from pre-control in a paired t test (**P < 0.005; *P < 0.05).
