
Figure 4. Vector analysis for testing directional tuning during different phases of the aiming task.
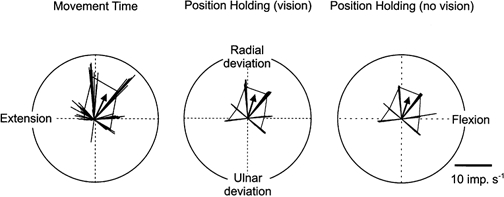
Polar plots demonstrating afferent activity in terms of vectors for an ECU primary spindle afferent in relation to wrist joint position. The thin lines represent vectors calculated at the occurrence of each spike. The length of the vector is equal to the instantaneous firing rate at the time of the spike while the angle of the vector is determined by hand position at that time. Average intratarget vectors were calculated from the instantaneous vectors related to a given target. The tips of these average intratarget vectors are at the cusps of the underlying polygon. A global mean intertarget vector (arrow) shows the directional tuning of the unit.