
Figure 7. Comparison of the pooled muscle afferent activity and tendon excursion estimates.
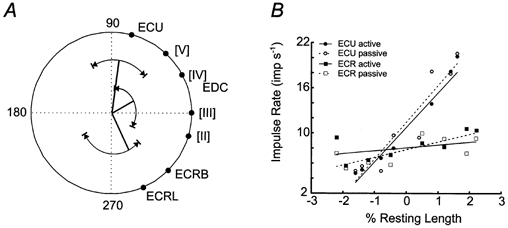
A, mean vectors are shown for the MT phase of spindle afferents from three muscles based on pooled data. Each mean vector of the spindle sub-samples is capped by an arc that illustrates the range of the directional tuning from the single unit data. Around the perimeter of the polar plot the directions of maximum tendon excursion for the forearm muscles are indicated. The spatial congruence of the population vectors and the tendon excursion estimates for ECU and ECR suggest that the muscle spindles in the respective muscles monitor muscle length in wrist joint space. B, impulse rate during position holding (PH phase) at each target is plotted in relation to the estimated tendon excursion in the parent muscle. Tendon excursion was normalized to percentage resting length to show the position sensitivity of the spindles.