
Figure 4. Localization of Ca2+ sparks and Ca2+ responses induced by ATP, membrane depolarization and Bay K8644.
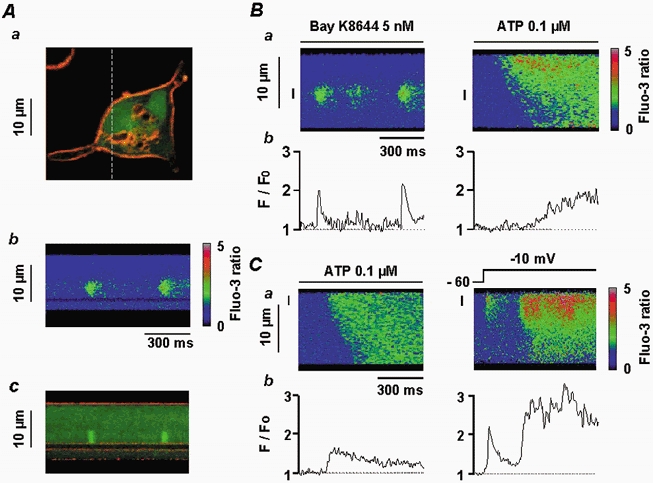
Aa, vascular myocyte stained with DI-8-Anepps (10 μm) and fluo 3 (60 μm) showing the plasma membrane (red) and cytosol (green). The dashed line corresponds to the scanned line. Ab, linescan image showing Ca2+ sparks. Ac, superimposition of Ca2+ sparks and DI-8-Anepps staining, illustrating the localization of the Ca2+ sparks close to the infolding of the plasma membrane shown in Aa. B, Ca2+ sparks triggered by application of 5 nm Bay K8644 and ATP-induced Ca2+ response in the same cell, shown as a linescan image (a) and spatial averaged fluorescence (b). Data are for the same 2 μm region indicated by the vertical line to the left of the corresponding linescan image. C, ATP-induced Ca2+ response and Ca2+ spark induced by a depolarization step from −60 to −10 mV in the same cell, shown as a linescan image (a) and spatial averaged fluorescence (b). Data are for the same 2 μm region indicated by the vertical line on the linescan image. Myocytes were loaded with fluo 3 via the patch pipette and held at −60 mV.