
Figure 5. Effects of anti-RYR and anti-InsP3R antibodies on ATP-induced Ca2+ responses.
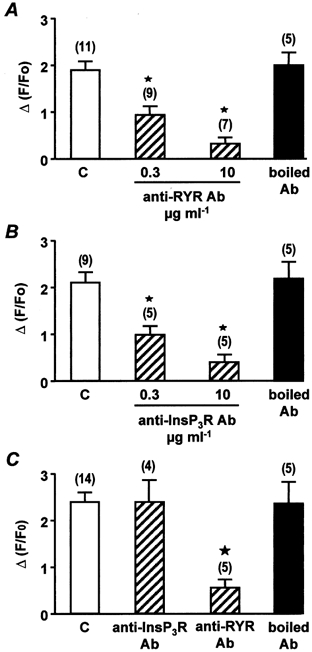
A, peak Ca2+ responses evoked by membrane depolarizations (−60 to 10 mV) in control conditions (C) and in the presence of increasing concentrations of anti-RYR antibody or 10 μg ml−1 boiled anti-RYR antibody, each applied intracellularly for 7 min. Data are means ±s.e.m. with the number of cells tested indicated in parentheses. B, peak Ca2+ responses evoked by 10 μm noradrenaline in control conditions (C) and in the presence of increasing concentrations of anti-InsP3R antibody or 10 μg ml−1 boiled anti-InsP3R antibody, each applied intracellularly for 7 min. Data are means ±s.e.m. with the number of cells tested indicated in parentheses. C, peak Ca2+ responses evoked by 10 μm ATP in control conditions (C) and in the presence of 10 μg ml−1 anti-InsP3R antibody, anti-RYR antibody or boiled anti-RYR antibody, each applied intracellularly for 7 min. Data are means ±s.e.m. with the number of cells tested indicated in parentheses. [Ca2+]i was measured in a 2 μm region of the linescan image. Cells were obtained from three different batches. ⋆, values significantly different from controls (P < 0.05). Myocytes were loaded with fluo 3 via the patch pipette and held at −60 mV.