
Figure 8. Effects of anti-RYR3 antibody on Ca2+ responses induced by ATP and caffeine.
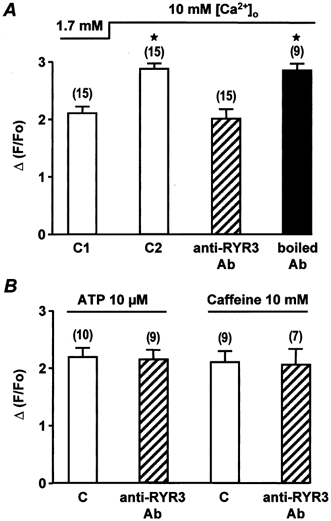
A, peak Ca2+ responses evoked by 10 mm caffeine in 1.7 mm[Ca2+]o (C1), 10 mm[Ca2+]o (C2) and in the presence of 10 μg ml−1 anti-RYR3 antibody or boiled anti-RYR3 antibody (applied intracellularly for 7 min). ⋆, values significantly different from controls in 1.7 mm[Ca2+]o (P < 0.05). B, peak Ca2+ responses evoked by 10 μm ATP and 10 mm caffeine in control conditions (C) in 1.7 mm[Ca2+]o and in the presence of 10 μg ml−1 anti-RYR3 antibody (applied intracellularly for 7 min). Data are means ±s.e.m. with the number of cells tested indicated in parentheses. Cells are obtained from two different batches. Myocytes were loaded with fluo 3 via the patch pipette and held at −60 mV.