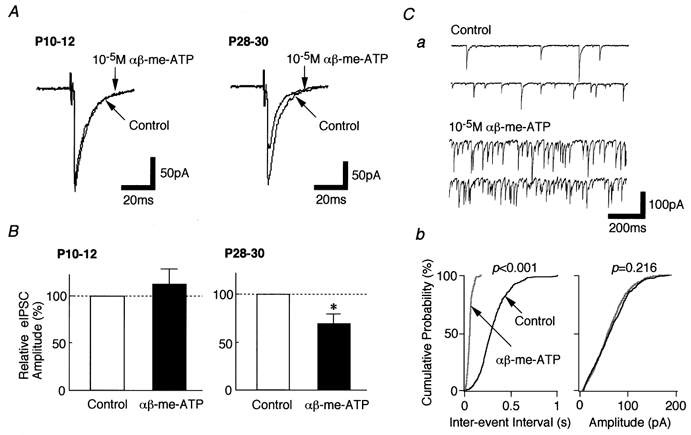
Figure 10. Effect of αβ-me-ATP on glycinergic eIPSCs.

All recordings were performed in the slice preparation using the whole cell patch clamp technique. The incubation medium contained 10−5m CNQX, 10−5m AP5 and 10−5m bicuculline, but not TTX. A, typical recordings of eIPSCs obtained from P10–12 neurones (left) and P28–30 neurones (right). B, each column is the mean of 4 (P10–12) and 6 (P28–30) neurones and was normalized to its respective control. *P < 0.05. Ca, typical traces of mIPSCs observed before and during the application of 10−5mαβ-me-ATP. Cb, cumulative probability plots for inter-event interval (left) and amplitude (right) of spontaneous IPSCs obtained from the same neurone. P values indicate the results of K-S test for frequency and amplitude (908 events for control and 1518 events for αβ-me-ATP).
