
Figure 4. The effect of UV irradiation on the GABA dose-response curve of GABA receptors.
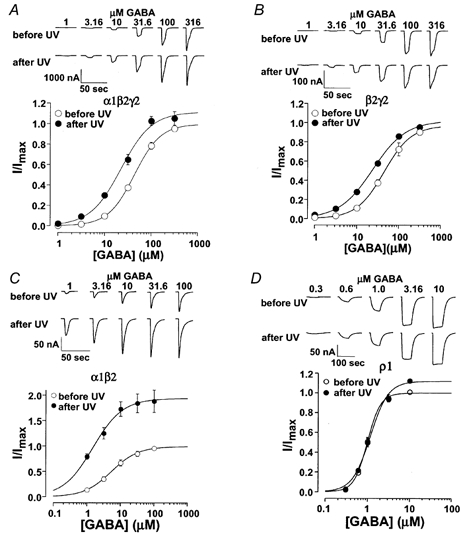
A, examples of current traces induced by a range of GABA concentrations before and after UV irradiation. The average of the normalized current was plotted against GABA concentration. Continuous lines are from least-squares fits of the data points to eqn (1). The resulting EC50 values and Hill coefficients are listed in Table 1. Note that UV irradiation shifted the GABA dose-response curve to the left about 2-fold, without a significant change in the maximum current. B and C, similar to A, but for β2γ2 and α1β2 GABAA receptors. Note that for α1β2, UV irradiation shifted the GABA dose-response curve to the left ∼3.8-fold, as well as increased the maximum current (∼2-fold). D, in contrast to α1β2γ2, β2γ2 and α1β2 receptors, homomeric ρ1 GABAC receptors were insensitive to UV irradiation.