
Figure 2. Voltage-current analysis of the Cs+-mediated depolarisation.
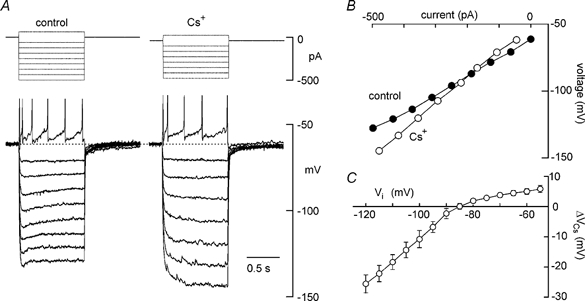
A, voltage responses (lower traces) to current pulses (upper) applied in the absence (control) and presence of 3 mm Cs+. All samples digitised in the last 100 ms of the voltage responses to each current pulse were averaged to determine steady-state voltage. B, plot of the steady-state voltage, measured in the absence and presence of Cs+, as a function of the absolute current being injected into the cell. Using graphs such as these, changes in voltage provoked by Cs+ (ΔVCs) at different initial voltages (Vi) were measured as the vertical difference (in mV) between the control and Cs+ curves, at 5 mV increments. C, a plot of mean (±s.e.m.) ΔVCs-Vi data measured in 5 different MNCs. Note that the plot shows strong inward rectification and a reversal of polarity near −85 mV.