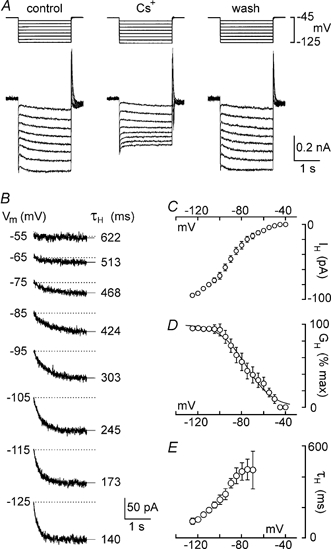
Figure 3. Cs+ blocks IH in rat MNCs.

Voltage-clamp recordings were made of the membrane currents evoked by voltage steps lasting 2.5 s to a variety of potentials (Vm) between −50 and −125 mV. Multiple trials were evoked in the absence and presence of Cs+, and current traces recorded in each condition were averaged to reduce noise. A, superimposed current traces (lower) resulting from voltage steps (upper) applied before (control), during (Cs+) and after (wash) application of 5 mm Cs+. All traces were obtained by averaging 3 individual trials in each condition. B, the Cs+-sensitive, time-dependent currents recorded at each Vm (noted at the left of each trace) obtained by digitally subtracting traces recorded in the presence of Cs+ from control traces. Superimposed on each trace is a monoexponential fit of the data points (thin line extending beyond the trace). The amplitude (difference between the end of the fit and the dotted line) and time constant of activation of the time-dependent current (τH; noted at the right of each trace) were derived from the fits. C, mean (±s.e.m.) current-voltage relationship of the Cs+-sensitive, time-dependent current (IH) recorded from 4 MNCs. D, mean conductance (GH)-voltage relationship derived from the data shown in C. The points are superimposed by a Boltzmann distribution (see Methods for details). E, plot of the mean (±s.e.m.) values of τH as a function of voltage. Note that activation kinetics accelerate with hyperpolarisation.
