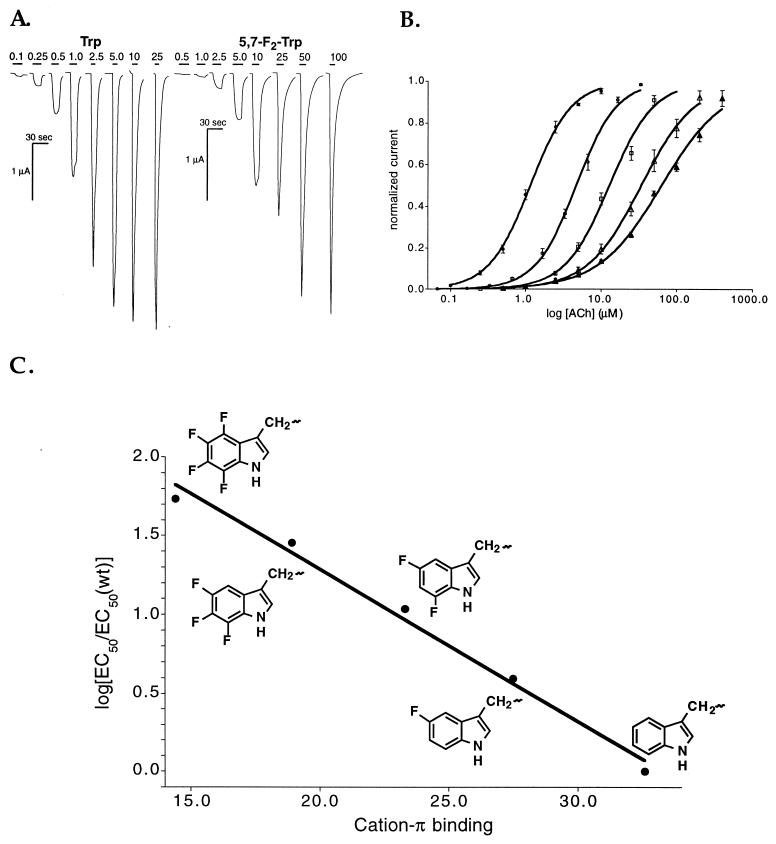
Figure 3.
(A) Representative voltage-clamp current traces from oocytes expressing Trp (wild type, Left) and 5,7-F2-Trp (Right) at α149. Bars represent application of ACh (μM). (B) Dose–response relations and fits to the Hill equation for (left to right): Trp; 5-F-Trp; 5,7-F2-Trp; 5,6,7-F3-Trp; and 4,5,6,7-F4-Trp. EC50 values are given in Table 2. (C) Plot of log[EC50/EC50(wild type)] vs. quantitative cation–π binding ability at α149 for the same residues as in B. Data are from Table 2. The data fit the line y = 3.2 − 0.096x, with a correlation coefficient r = 0.99. Error bars are approximately the size of the markers.

