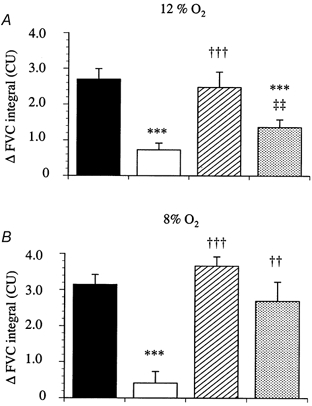
Figure 2. Effects of l-NAME, l-NAME with SNP and l-NAME with SNP and ZM243185 on the changes in FVC evoked by hypoxia.

Each column represents the mean ±s.e.m. of the change in integrated FVC after 12 % inspired O2 (A) and 8 % inspired O2 (B), for control responses (▪), after l-NAME (10 mg kg−1, □), after l-NAME and SNP (10 μg kg−1 min−1,  ) and after l-NAME, SNP and ZM243185 (0.05 mg kg−1,
  ). ***P < 0.001 vs. control; ††P < 0.01, †††P < 0.001 vs.l-NAME; ‡‡P < 0.01 vs.l-NAME + SNP.
