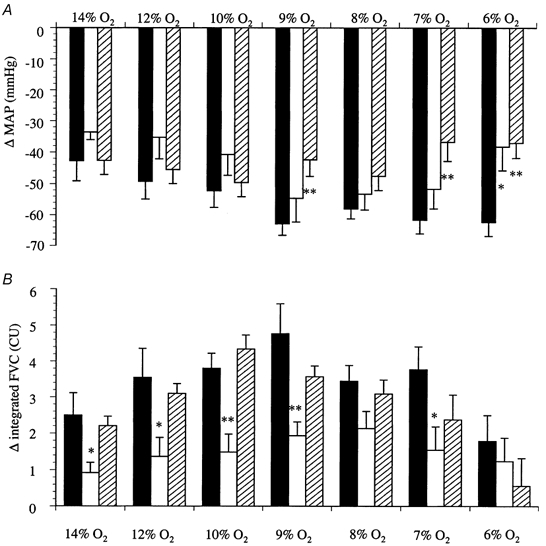
Figure 3. Changes in MAP and FVC evoked by graded systemic hypoxia.

Each column represents the mean ±s.e.m. of the change in MAP (A) or integrated FVC (B) recorded over 5 min periods of hypoxia; the percentage O2 in the inspirate is indicated for each column. Control animals, ▪; after DPCPX (0.1 mg kg−1, i.v..), □; and after ZM243186 (0.05 mg kg−1, i.v..),  . *P < 0.05 and **P < 0.01, when compared with control.
