
Figure 5. Bar histogram to show the effect of ionophoretic application of WAY-100635 on the excitation of CVPNs evoked by a right-atrial injection of PBG.
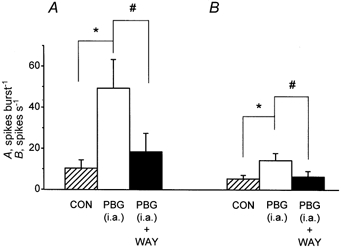
Histograms of the mean data (n = 8) of CVPN activity with vertical bars showing s.e. From left to right: background activity ( CON), activity evoked by right-atrial (i.a.) injections of PBG (□) and the effect of WAY-100635 (WAY) on the activity evoked by a right-atrial injection of PBG (▪). A, the whole burst. B, the 1st second of excitation (in spikes s−1) within a 5 s window after a right-atrial injection of PBG. This activity was compared using Student's paired t test. *#P < 0.05.