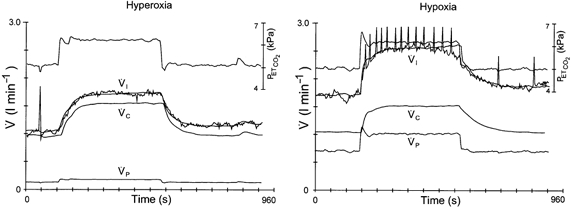
Figure 3. CO2–O2 stimulus interaction in the control situation.

Two DEF runs obtained in the control situation during hyperoxia (left panel) and hypoxia (right panel). Upper traces are end-tidal  . Breath-by-breath data points of inspiratory ventilation (
 ) are connected; the smooth line represents the optimal model fit.
  and
and  are the calculated contributions of the central and peripheral chemoreflex loops, respectively, to the change in ventilation. The sensitivity of the peripheral chemoreflex loop is considerably larger during hypoxia.
