
Figure 4. Absence of CO2–O2 stimulus interaction after administration of acetazolamide.
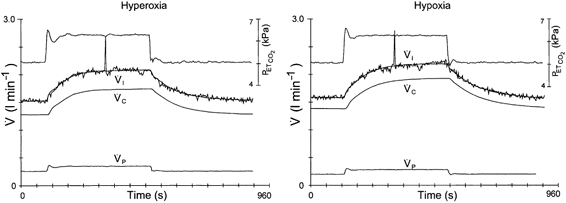
Two DEF runs obtained during hyperoxia (left panel) and hypoxia (right panel) after 4 mg−1 kg−1 acetazolamide. Upper traces are end-tidal  . Breath-by-breath data points of inspiratory ventilation (
 ) are connected; the smooth line represents the optimal model fit.
  and
and  are the calculated contributions of the central and peripheral chemoreflex loops, respectively, to the change in ventilation. Going from hyperoxia into hypoxia does not result in an increased contribution of the peripheral chemoreflex loop to the change in ventilation.