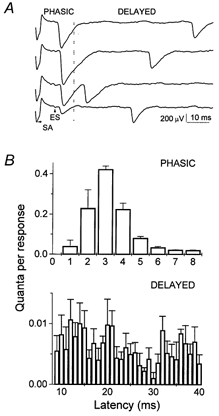
Figure 2. Phasic and delayed release components.

A, recordings showing phasic and delayed events. SA is a stimulus artifact; ES is an extracellular spike. B, quantal latency histogram from 600 EPSPs showing a phasic component which decays within 8 ms and a delayed component which does not decay. Data were collected with HS (500 mm sucrose) applied.
