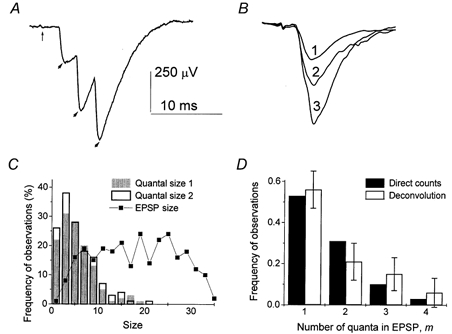
Figure 3. Quantal analysis.

A, at a low-output synapse quantal events can be detected as peaks of EPSP. The vertical thin arrow points to the extracellular spike, and the thick arrows point to quantal peaks. B, averaged EPSPs with 1, 2 and 3 quantal events detected. The size (integrated trace) of the average double quantal EPSP is about 2 (1.8) times larger than the quantal size; the size of the average triple quantal EPSP is about 3 (2.7) times larger than the quantal size. These ratios confirm the correct quantal detection. Analysis of 600 EPSPs collected at 7 Hz stimulation frequency. C, distributions of EPSP sizes and quantal sizes used for calculation of m by deconvolution. The histograms of quantal sizes at the beginning (filled columns) and at the end (open columns) of the experiment are similar. D, at a low-output synapse distributions of quantal content m obtained by direct counts (filled columns) and by deconvolution (open columns) are in a good agreement. Analysis of 600 EPSPs collected at 10 Hz stimulation frequency. Error bars indicate confidence intervals for the calculated distribution.
