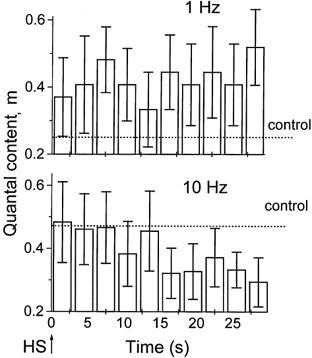
Figure 8. Time course of quantal content after HS application.

Each column represents m averaged over 3 s (3 EPSPs at 1 Hz and 30 EPSPs at 10 Hz). At 1 Hz stimulation m remained at a steady level above control. At 10 Hz stimulation m decayed and dropped below control. Data were collected from 9 recording sites at 1 Hz and from 6 recording sites at 10 Hz.
