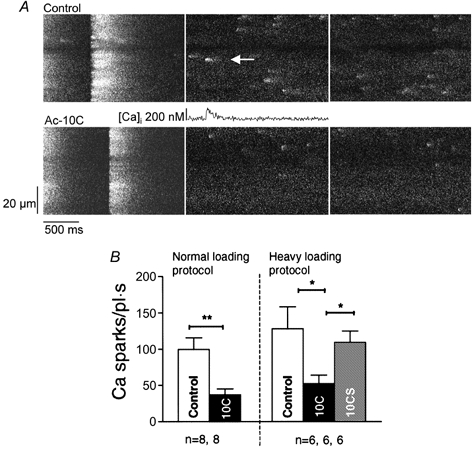
Figure 3. Resting Ca2+ spark frequency comparisons.

A, confocal line-scan images from a control (upper series) and an Ac-10C (lower series) cell. The images show the resting Ca2+ sparks recorded following the last twitch transient. The scan line was oriented along the longitudinal cell axis. A Ca2+ spark profile is shown for the spot indicated by the arrow. B, summary of Ca2+ spark frequency measured in normal and heavy loading protocol. The depression of resting Ca2+ spark frequency by Ac-10C was 62 % (P < 0.05) in normal loading conditions compared with control, and 59 and 51 % (P < 0.05) in heavy loading conditions compared with control and Ac-10CS cells, respectively.
