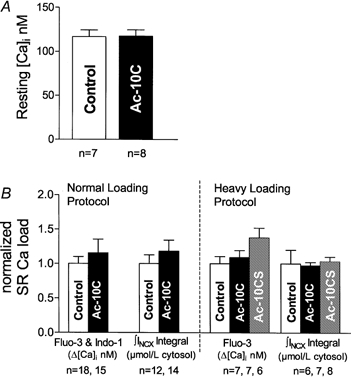
Figure 4. Intracellular resting [Ca2+]i and SR Ca2+ load comparisons.

A, resting [Ca2+]i was measured using indo-1 during the same normal loading protocol as the Ca2+ spark measurements, and Ac-10C had no effect. B, SR Ca2+ load was measured by the Ca transient (Δ[Ca2+]i in nm) and by the integral of Na+–Ca2+ exchange current (∫INCX, μmol (l cytosol)−1) upon application of 10 mm caffeine onto the cell through fast solution switch. Figure 2 shows an example recording of caffeine-induced Δ[Ca2+]i and INCX. The bar graph summarizes the SR Ca2+ loads from different recording conditions. Values are normalized to the mean value for the control cells (see text).
