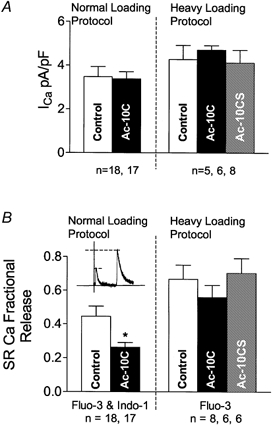
Figure 5. ICa and SR Ca2+ fractional release.

A, ICa was measured from control, Ac-10C and Ac-10CS cells in normal and heavy loading protocols (∼12 min after rupturing the patch). B, SR Ca2+ fraction release (SRCaFR; measured as Δ[Ca2+]i for twitch/caffeine) was reduced by Ac-10C, based on the measurements using both fluo-3 and indo-1 in the normal loading protocol. *P < 0.05 vs. Control.
