
Figure 1. An example of a ‘stack plot’ of the time-sequence spectra during a high-intensity rest- exercise-rest-exercise-rest protocol (subject 1).
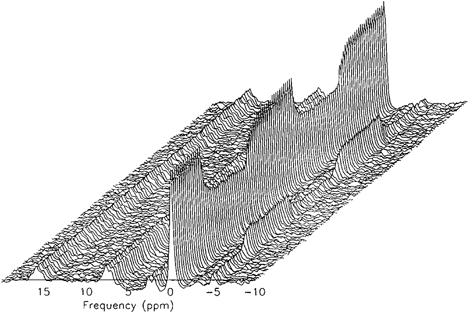
[PCr], 0 p.p.m.; [Pi], −5 p.p.m.; γ, α and β[ATP], approximately 2.5, 7.5 and 16 p.p.m.
Official websites use .gov
A
.gov website belongs to an official
government organization in the United States.
Secure .gov websites use HTTPS
A lock (
) or https:// means you've safely
connected to the .gov website. Share sensitive
information only on official, secure websites.
[PCr], 0 p.p.m.; [Pi], −5 p.p.m.; γ, α and β[ATP], approximately 2.5, 7.5 and 16 p.p.m.