
Figure 3. The response of  to repeated high-intensity exercise in subject 1.
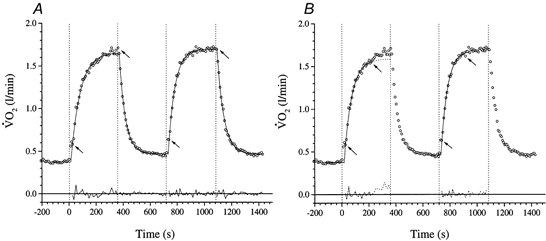
A is fitted with model A (i.e. the whole 360 s response is fitted with a single exponential). B shows the fit to the same data using the model B a posteriori approach (see text) to identify the exponential region. The arrows indicate the ‘fitting window’. The residuals to the fitted responses are shown below.